
📘 This article explains how to change the Botify crawler speed while a crawl is underway.
Overview
While a crawl is in progress, the crawl statistics are displayed in real-time, and you can adjust the crawl speed. There is no limit to crawl speed if you have validated your website. If you are crawling a non-verified website, the crawl is limited to three pages per second. The reasonable speed limit is what your website will tolerate. While some websites will easily tolerate a crawl at 100 pages per second, others will start having difficulties at ten or less.
Determining Crawl Speed
We recommend trying three or five pages per second and evaluating by checking the average response time and whether there are server or network errors during the first minutes of the crawl. Continue monitoring since websites will typically struggle for some time before returning errors. If everything is fine, then you can increase the crawler speed. We recommend not increasing the crawl speed if the response time is over 1,000 to 1,500 milliseconds.
There is no risk of overloading your servers because you can configure Botify's crawl speed if you validated your website. Botify also adjusts the crawl speed automatically based on the server's response time during the crawl, which can indicate server overload. However, the crawler's goal is to get as close as possible to the configured crawl speed, which should be within the limits of your web servers' load. Read more about the Performance Impact of Robot Crawls.
Evaluating Crawl Statistics
Use the real-time crawl statistics to evaluate whether you need to adjust the crawl speed. Real-time crawl statistics include the following:
Number of Crawled URLs and HTTP Status Codes
These graphs provide the following:
Whether the web server is returning pages as fast as expected, with the amount of URLs explored each minute (the Botify crawler will not be the limiting factor: it can crawl over 200 pages per second).
Whether URLs are returning content successfully vs. errors and redirects, with the HTTP status code distribution.
The following example shows a crawl set up to run five pages per second. The flat graph indicates the server returns pages easily at the configured speed (which corresponds to 300 pages per minute), and all pages return content successfully:

In this example, the crawl was configured to run at a maximum speed of three pages per second, or 180 pages per minute. The steady amount of pages returning redirects (3xx in yellow) or client errors (4xx, which include "404 Not found", in orange) does not impact crawl speed, but it could if error pages (in particular, HTTP 5xx server errors) were slow and found in great proportion.

In this final example, the crawl was set to run at three pages per second. This maximum speed was achieved for some time; then, the crawl speed suddenly dropped. The web server is not delivering pages fast enough anymore.

Determining Why the Crawl is Slow
If the crawl is much slower than expected, look at the performance impact of robot crawls. Consider lowering the crawl speed when the actual crawl speed is much lower than the maximum speed: when it has been since the beginning or when it suddenly drops, as in the example above, and remains low.
The Botify crawler will not attempt to achieve the configured speed at any cost. For instance, if the maximum speed is set to five pages per second, the crawler will not send ten simultaneous requests to get five replies on time. If the maximum crawl speed is N pages per second, Botify will always:
Limit the number of new requests sent to N per second.
Limit the number of requests with a pending reply to 3 x N.
The second point may become the limiting factor if your website is slow. The crawler will still try to reach the configured speed within the above limits, and the configured speed may be too much for your server. If the crawl speed is too high, you can lower the crawl speed while the crawl is running. The response time also indicates how easily your web server returns pages.
Average Fetch + Render Time
In the graph that shows the average response time, you will see if the website is slow or slower than expected.

This is the response time to deliver the full page code without any associated resources (such as CSS files or images on the page), which is different from the response time experienced by users. We recommend delivering pages in less than 500 milliseconds. Response times under a second can still be considered acceptable. Variance within the acceptable range is normal, as response time will typically vary depending on the page template or the HTTP status code.
If you notice a significant change in the trend, check the crawl volume minute-by-minute around the time of the change: a higher response time that lasts but does not affect the crawl rate means the server "breathes" less between pages but is still managing fine.
The example below shows an extremely high average delay:

Amount of Bandwidth Used by the Crawl
This graph may be useful to understand how much the crawl fills the pipe front of the web server, to avoid or identify a network bottleneck:

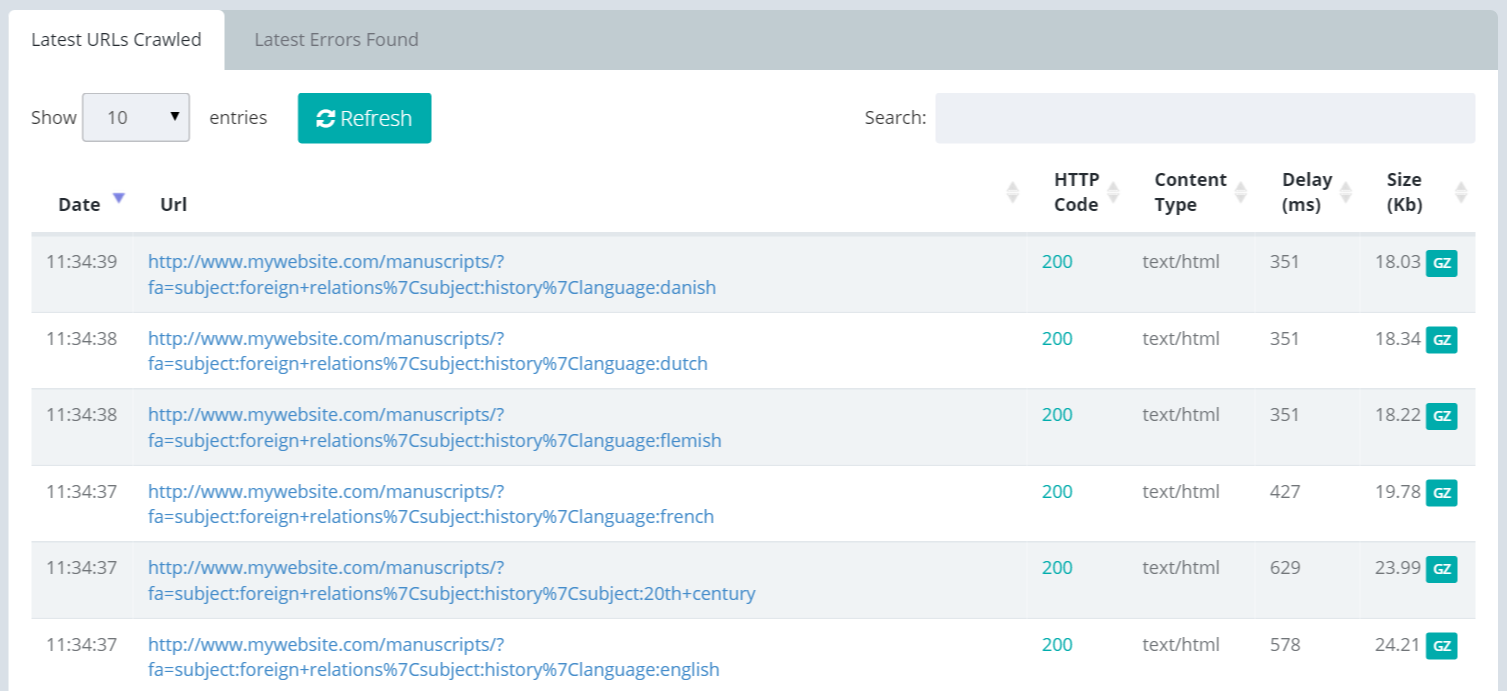
Latest URLs Crawled
You can also see the 1,000 latest URLs crawled, and the 1,000 latest errors in the second tab to identify URLs that may be causing problems. Explore each list by searching for an element in the URL (the list is refreshed when you enter something in the search box).
Adjusting Speed Settings
You can change the crawl speed during a crawl. To adjust the speed:
If you are not already on the Analysis Settings page, navigate to the Crawl Manager from the main project navigation bar, and click the Watch Live Stats button.
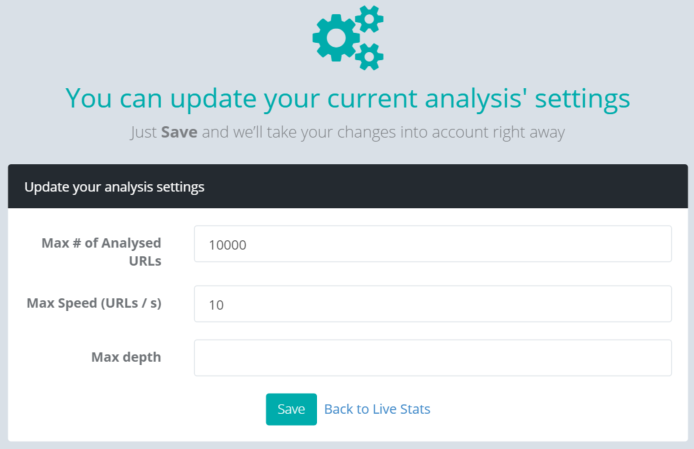
In the Analysis Settings section, click the Settings button.

In the Max Speed field, identify the maximum number of pages to crawl per second.
Alternatively, adjust the maximum number of URLs crawled or the maximum depth (number of clicks from the start page) to stop the crawl sooner than planned:

Click Save. The new settings will be applied immediately.
See also: